MLflow Observability for Google ADK
Learn how to use MLflow Tracing to observe and debug Google ADK agents and tools using OpenTelemetry.
Published on • 2026-03-07
AI Assistant

MLflow Observability for Google ADK
Observability is a critical component when building applications with Large Language Models (LLMs). As AI agents become more autonomous and complex, understanding their decision-making processes, tool usage, and performance bottlenecks is essential.
MLflow Tracing provides robust, first-class support for ingesting OpenTelemetry (OTel) traces. Fortunately, Google ADK emits OTel spans for agent runs, tool calls, and model requests natively, allowing you to send them directly to an MLflow Tracking Server for seamless analysis and debugging.
In this guide, we’ll walk through how to set up MLflow tracing for your Google ADK agents.
Architecture Overview
graph TD
    subgraph "Application Environment"
        A[ADK Agent] -->|Triggers| B[Agent Runner]
        B -->|Executes| C[Tools / LLM Calls]

        subgraph "Observability Layer"
            D[OpenTelemetry SDK]
            E[GoogleADKInstrumentor]
        end

        C -.->|Auto-instrumentation| E
        E -->|Captures Spans| D
    end

    subgraph "MLOps Infrastructure"
        F[MLflow Tracking Server]
        G[(MLflow Backend Store)]
        H[MLflow UI]
    end

    D -->|Export Traces| F
    F -->|Persist| G
    H -->|Visualize| F

    style A fill:#4285F4,color:#fff
    style F fill:#0194E2,color:#fff
    style E fill:#34A853,color:#fff
Prerequisites
Before diving in, ensure you have the following ready:
- MLflow 3.6.0+: OpenTelemetry ingestion is supported only in version 3.6.0 and newer.
- A SQL-based Backend Store: You’ll need a database like SQLite, PostgreSQL, or MySQL. File-based stores do not support OTLP ingestion.
- Google ADK: Make sure the ADK is installed in your development environment.
1. Install Dependencies
First, let’s install the necessary packages. We need MLflow, the Google ADK, and the required OpenTelemetry SDK and exporter:
pip install "mlflow>=3.6.0" google-adk opentelemetry-sdk opentelemetry-exporter-otlp-proto-http2. Start the MLflow Tracking Server
Next, initialize the MLflow tracking server using a SQL backend. In this example, we’ll use a local SQLite database and bind the server to port 5000:
mlflow server --backend-store-uri sqlite:///mlflow.db --port 5000Note: You can easily substitute --backend-store-uri to point to PostgreSQL, MySQL, or MSSQL for production deployments. Remember, OTLP ingestion won’t work with file-based backends!
3. Configure OpenTelemetry
For spans to be correctly emitted to MLflow, it is crucial to configure an OTLP exporter and set a global tracer provider before interacting with any ADK components.
Add the following initialization code at the very top of your application script:
# my_agent/agent.py
from opentelemetry import trace
from opentelemetry.exporter.otlp.proto.http.trace_exporter import OTLPSpanExporter
from opentelemetry.sdk.trace import TracerProvider
from opentelemetry.sdk.trace.export import SimpleSpanProcessor

# 1. Initialize the OTLP Exporter
exporter = OTLPSpanExporter(
    endpoint="http://localhost:5000/v1/traces",
    headers={"x-mlflow-experiment-id": "123"}  # Replace with your actual experiment ID
)

# 2. Set the Global Tracer Provider
provider = TracerProvider()
provider.add_span_processor(SimpleSpanProcessor(exporter))
trace.set_tracer_provider(provider)  # CRITICAL: Set this BEFORE importing/using ADK
This ensures the OpenTelemetry pipeline is properly configured to route ADK spans to your MLflow instance.
4. Trace an ADK Agent in Action
With OpenTelemetry configured, we can now define our agent. Let’s create a simple math agent equipped with a calculator tool to demonstrate tracing:
# my_agent/agent.py
from google.adk.agents import LlmAgent
from google.adk.tools import FunctionTool

def calculator(a: float, b: float) -> str:
    """Add two numbers and return the result."""
    return str(a + b)

calculator_tool = FunctionTool(func=calculator)

root_agent = LlmAgent(
    name="MathAgent",
    model="gemini-2.5-flash",
    instruction=(
        "You are a helpful assistant that can do math. "
        "When asked a math problem, use the calculator tool to solve it."
    ),
    tools=[calculator_tool],
)
You can now run this agent using the ADK CLI:
adk run my_agentTry asking it a question:
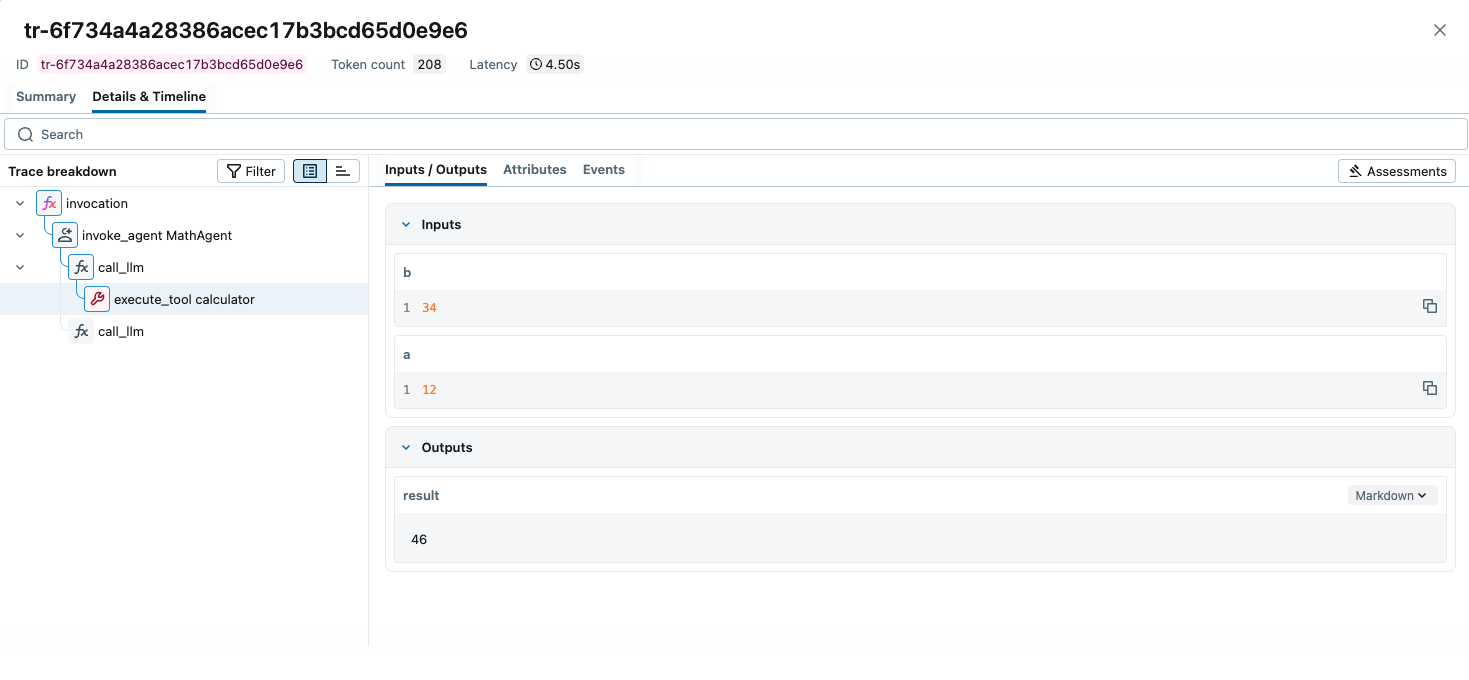
> What is 12 + 34?
[MathAgent]: The answer is 46.
5. View Your Traces in MLflow
Head over to the MLflow UI by navigating to http://localhost:5000 in your web browser. Select your experiment (e.g., ID 123) to view the captured traces. You’ll be able to inspect the trace tree, delve into individual spans, view the exact prompts sent to the model, and monitor the inputs and outputs of your calculator tool.
Troubleshooting adk web Tracing
If you are seeing traces when running your agent via a script (adk run) but nothing appears when using the adk web command, it is likely because the adk web CLI starts a separate server process that doesn’t “see” the OTel configuration you wrote in your Python files.
To fix this, you need to pass the OpenTelemetry configuration directly to the adk web environment.
1. Use the --otel_to_cloud Flag
The ADK CLI has a built-in flag to enable OpenTelemetry. Even if you aren’t sending to “Google Cloud,” this flag activates the internal ADK tracing hooks that MLflow needs to hook into.
adk web --otel_to_cloud2. Set Environment Variables in your Shell
Since adk web is a standalone command, it relies on system environment variables rather than your script’s logic to know where to send traces. Run these in your terminal before starting the web UI:
# Point to your MLflow server's OTLP endpoint
export OTEL_EXPORTER_OTLP_TRACES_ENDPOINT="http://localhost:5000/v1/traces"

# Tell MLflow which experiment to use (Experiment 0 is the default)
export OTEL_EXPORTER_OTLP_HEADERS="x-mlflow-experiment-id=0"

# (Optional) Give your agent a name in the MLflow UI
export OTEL_SERVICE_NAME="adk-web-agent"

# Now run the web UI
adk web --otel_to_cloud
3. Check for Common “Silent” Failures
If the variables are set but you still see nothing, check these two “gotchas”:
-
The SQL Backend Requirement: MLflow cannot receive OTel traces if it was started normally (which defaults to file-based storage). You must have started your MLflow server using a database URI:
mlflow server --backend-store-uri sqlite:///mlflow.db -
The
.envFile: If you are using an.envfile in your project folder, make sure theseOTEL_variables are inside it. The ADK web server usually looks for a.envfile in the current directory.
Summary Checklist
- Ensure MLflow is running with
--backend-store-uri sqlite:///... - Set
OTEL_EXPORTER_OTLP_TRACES_ENDPOINTin your terminal. - Set
OTEL_EXPORTER_OTLP_HEADERSwith your experiment ID. - Run
adk web --otel_to_cloud.
Best Practices & Tips
- Strict Execution Order: Always configure the tracer provider before importing or initializing Google ADK objects. Failing to do so will result in missing spans.
- Remote MLflow Servers: If you are running MLflow behind a proxy or on a separate remote host, ensure you update the
endpointinOTLPSpanExporterfromhttp://localhost:5000to the correct remote address.
By integrating MLflow Observability with Google ADK, you gain the visibility required to confidently build, debug, and scale your AI agent workflows.